“Track meetings booked” is incomplete advice. A calendar full of discovery calls can hide poor targeting, weak qualification, missed appointments, and opportunities that never move beyond an introductory conversation. Bookings matter, but they aren't revenue, and they don't tell you where prospecting breaks down.
Useful business development KPIs follow the buyer from the first LinkedIn touch through qualification, opportunity creation, and closed business. Each metric should answer an operating question: Are we reaching the right people? Are they interested? Does sales accept the opportunity? Can we acquire the customer profitably?
For a small B2B team, the answer isn't a bigger dashboard. It's a short set of metrics with consistent definitions, clear owners, and a review process that identifies the earliest weak stage.
Operating rule: Find the first meaningful drop in conversion before increasing outreach volume. More prospects won't fix a broken handoff.
The following KPIs connect outreach activity to pipeline progress and revenue. Choose the ones that fit your current bottleneck, rather than treating every available number as a management priority.
Table of Contents
- 1. LinkedIn Connection Acceptance Rate
- 2. Reply Rate and Positive Reply Rate
- 3. Qualified Appointments Booked
- 4. Meeting Show-Up Rate
- 5. Lead-to-Opportunity Conversion Rate
- 6. Pipeline Value Generated
- 7. Win Rate on Outbound-Sourced Opportunities
- 8. Cost per Qualified Appointment
- 9. Sales Cycle Length
- 10. Customer Acquisition Cost (CAC) and CAC Payback Period
- How the 10 business development KPIs compare by funnel stage, calculation, and use
- Build a Pipeline Review Routine Around Your Few Core KPIs
1. LinkedIn Connection Acceptance Rate
LinkedIn connection acceptance rate measures the share of connection requests that prospects accept. It's the first observable conversion in a connection-led outreach sequence.
Formula: Accepted connection requests ÷ connection requests sent, expressed as a percentage.
Compare requests from the same sending period and allow time for acceptance. Dividing this week's acceptances by this week's invitations can distort results when prospects respond to older requests.
Diagnose targeting before rewriting messages
Say you're targeting operations directors at manufacturers. A broad Sales Navigator search produces weak acceptance, while a narrower search with relevant company filters and exclusions performs better. Start by revising the list, not rewriting every follow-up.
Check whether your LinkedIn headline, About section, and company page support the reason you're approaching that audience. A relevant invitation followed by a vague profile creates an avoidable credibility problem.
- Segment the results: Compare job titles, industries, company sizes, and list-building methods.
- Keep conditions comparable: Avoid changing invitation volume, targeting, and connection copy together.
- Inspect public positioning: Use this LinkedIn Social Selling Index guide to review profile alignment, without treating SSI as a substitute for pipeline outcomes.
Selection test: Prioritize acceptance rate when launching a LinkedIn campaign or testing an unfamiliar audience. Once acceptance is stable, use it as a diagnostic metric rather than your main success measure.
2. Reply Rate and Positive Reply Rate
A reply saying “not relevant” proves that someone answered. It doesn't prove that your offer resonates. Reply rate and positive reply rate need separate definitions.
Reply rate: Unique prospects who reply ÷ unique prospects contacted, expressed as a percentage.
Positive reply rate: Unique prospects expressing relevant interest ÷ unique prospects contacted, expressed as a percentage.
Use the same denominator for both. Count people, not individual messages, so an extended conversation doesn't inflate performance.
Classify interest consistently
Define positive replies before launch. Requests for relevant information, interest in discussing a stated problem, and agreement to a suitable meeting can qualify. Automated responses, polite declines, and unrelated partnership pitches shouldn't.
Say a professional services team tests a follow-up focused on an industry-specific operational problem. If positive replies improve while overall replies remain similar, the new message may be attracting more useful interest rather than provoking responses.
Selection test: Use these KPIs when prospects accept connections but rarely progress into relevant conversations. Review results by sequence step and change a single variable, such as the message premise or meeting request.
Also recognize their limits. Two-thirds of B2B buyers prefer engaging with sales only after conducting their own research, according to G2's 2025 buyer-behavior report. Keep assisted engagement separate from sourced opportunities, and don't assume every silent prospect ignored the message.
3. Qualified Appointments Booked
Qualified appointments booked counts scheduled sales conversations that meet your written fit and interest requirements. It's more useful than total bookings because it separates calendar activity from conversations your sales team should pursue.
Calculation: Count distinct booked appointments that pass the agreed qualification criteria.
A booked appointment is still an intermediate outcome. Don't label it pipeline until sales confirms there's a credible opportunity.

Agree on what qualifies
Record the criteria in your CRM rather than relying on a rep's interpretation:
- Account fit: Industry, company size, geography, and relevant business model.
- Buyer involvement: Decision-making authority or a credible route to the buying group.
- Problem fit: A stated need your offer can reasonably address.
- Meeting purpose: A clear reason to talk and an agreed next step.
For a consulting firm, a relevant executive exploring a matching operational problem may qualify. A junior employee seeking free advice may not, even if they accept a calendar invitation.
Salesforce's State of Sales report describes higher-performing organizations using analytics and CRM data to evaluate opportunity conversion and revenue. Apply that discipline to appointment records, not just later sales stages.
Selection test: Choose this KPI when outreach generates interest but sales questions meeting quality. When evaluating B2B appointment-setting services, make the qualification definition and handoff ownership explicit.
4. Meeting Show-Up Rate
A prospect who books but doesn't attend hasn't completed a sales conversation. Meeting show-up rate measures whether scheduled interest becomes an actual discussion.
Formula: Appointments held ÷ appointments scheduled to occur, expressed as a percentage.
Use the scheduled meeting date, not the booking date, to organize reporting. Keep rescheduled appointments identifiable so they aren't counted as fresh demand every time the calendar changes.
Separate attendance problems from interest problems
The Lead-Spot benchmark compilation reports an overall B2B meeting no-show rate of 6.5%, rising to 23% when meetings are booked eight or more days ahead. Treat those figures as directional context, not a universal attendance target.
Say a team notices that distant bookings frequently lapse. Before changing its audience, it offers nearer meeting slots and sends a confirmation explaining the business problem, attendees, and intended outcome.
- Confirm the purpose: Include a brief agenda immediately after booking.
- Make attendance easy: Check time zones, meeting access, and calendar acceptance.
- Record the outcome: Distinguish attended, canceled, rescheduled, and unexplained absence.
A no-show is a reason to inspect the booking process, not automatic proof that the prospect was unqualified.
Selection test: Prioritize show-up rate when bookings look healthy but salespeople report empty calendars. If attendance improves without better opportunity creation, investigate qualification and discovery rather than adding more reminders.
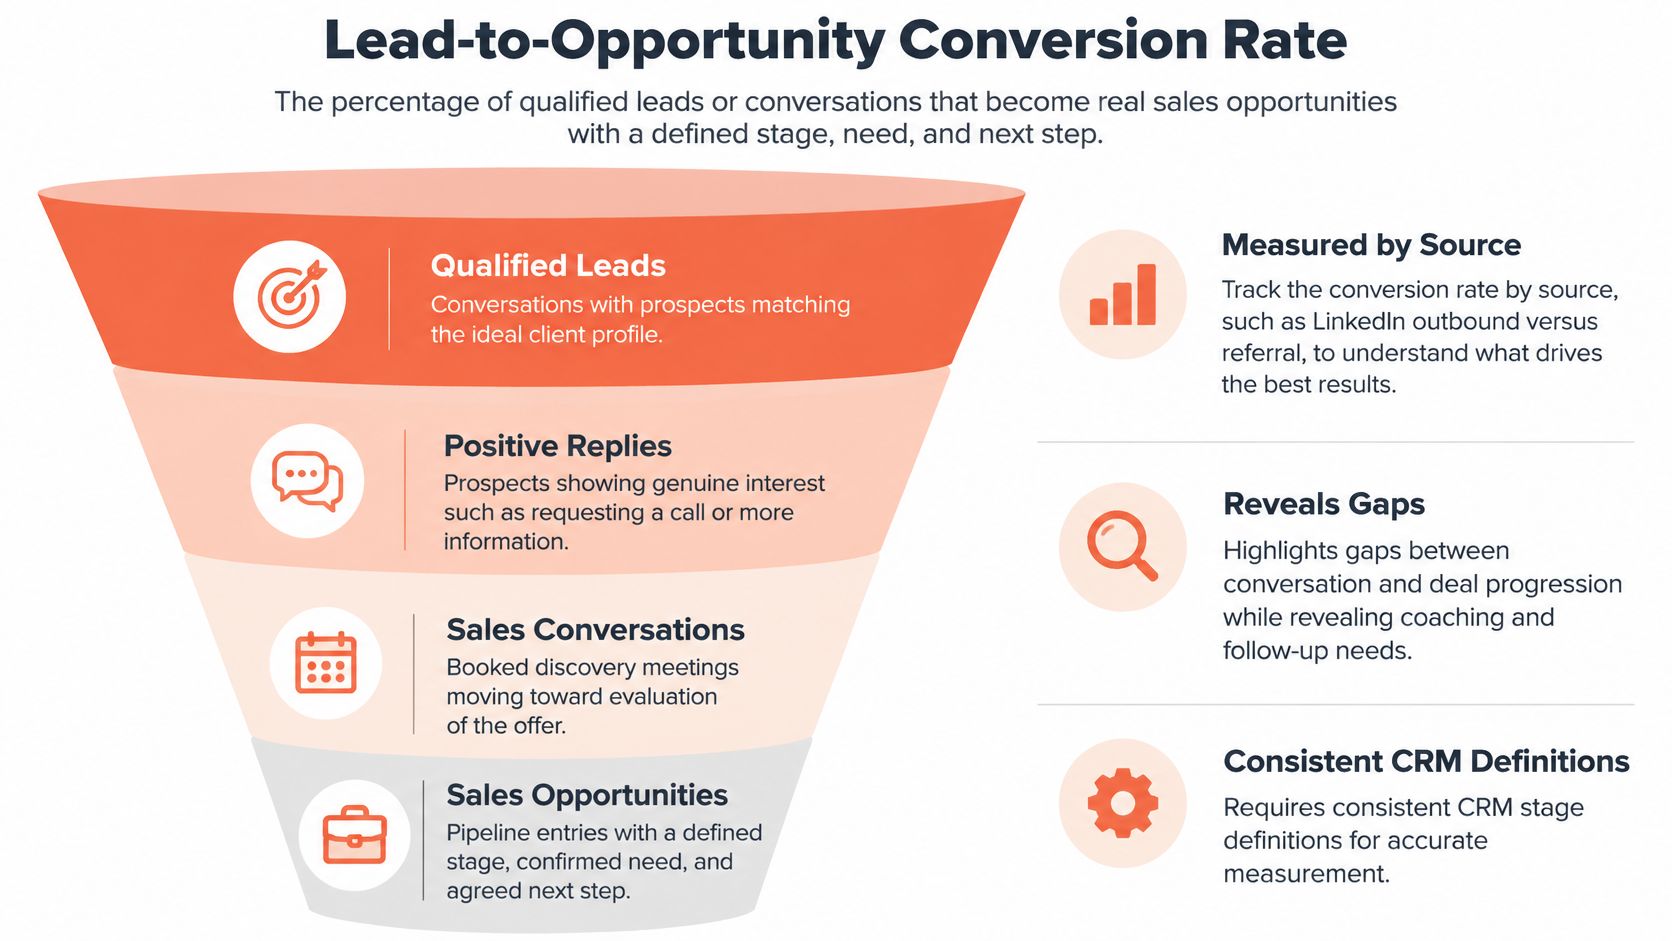
5. Lead-to-Opportunity Conversion Rate
Lead-to-opportunity conversion rate measures how often qualified interest becomes a sales-accepted opportunity. It separates someone willing to talk from someone actively evaluating a relevant purchase.
Formula: Sales-accepted opportunities created ÷ qualified leads in the same cohort, expressed as a percentage.
Define “qualified lead” precisely. If your denominator is held discovery calls, label the metric held-meeting-to-opportunity conversion instead of implying it includes every lead.
Require evidence before creating an opportunity
An opportunity should have a relevant problem, plausible commercial fit, a named owner, and a buyer-agreed next action. A rep's hope that a prospect might buy isn't enough.
The Articos funnel-conversion guide compiles a directional 30–50% SQL-to-opportunity conversion range. Only compare against it if your sales-qualified lead definition is reasonably comparable; otherwise, your own consistently measured baseline is more useful.
Say a founder finds that outbound discovery calls convert less often than referrals. Reviewing call notes may reveal weak next-step requests, poor account fit, or prospects researching without an active project. Each explanation requires a different response.
Selection test: Choose this KPI when meetings happen but pipeline doesn't grow. Segment by source and persona, inspect the rejected conversations, and assign follow-up ownership before changing outreach volume.
6. Pipeline Value Generated
A campaign can create many opportunities without producing enough commercial potential to justify the effort. Pipeline value generated translates accepted opportunities into estimated contract value.
Formula: Sum the estimated values of newly created, outbound-sourced opportunities during the reporting period.
Use a consistent valuation basis, such as expected initial contract value. Don't mix annual recurring revenue, total multiyear contract value, and speculative expansion into the same total.
Keep pipeline separate from forecast
Unweighted pipeline describes potential business. A weighted forecast applies expected win probabilities and timing. Neither should be presented as booked revenue.
Gartner reports that only 7% of teams achieve forecast accuracy of at least 90% on its sales AI topic page. That's a reason to inspect the assumptions behind opportunity values, not to treat every CRM amount as equally credible.
For example, a consulting firm might find that smaller accounts generate less nominal pipeline but reach commercial decisions sooner. Review value alongside win rate, cycle length, and delivery margin before redirecting targeting toward larger accounts.
- Validate large deals: Confirm scope, buyer involvement, and the basis for the estimate.
- Separate attribution: Report outbound-sourced pipeline apart from outbound-assisted pipeline.
- Monitor changes: Distinguish newly created value from increases to existing opportunities.
Selection test: Use pipeline value when opportunity qualification is consistent and leadership needs a financial view of prospecting. If stage definitions are loose, fix those before setting pipeline targets.
7. Win Rate on Outbound-Sourced Opportunities
Outbound opportunity win rate shows whether the opportunities your team accepts eventually become customers. It tests targeting and qualification alongside the effectiveness of the sales process.
Formula: Won outbound-sourced deals ÷ all closed outbound-sourced deals, expressed as a percentage.
Include both won and lost deals in the denominator. Open opportunities don't belong there, and excluding losses makes the result meaningless.
Compare like with like
Say an advisory firm notices stronger results from conversations with budget-owning executives than from operational influencers. Before changing its persona strategy, it checks whether the groups involve comparable services, deal sizes, and opportunity ages.
A higher win rate from a tiny or unusually mature group isn't enough to justify a wholesale targeting change.
- Segment carefully: Compare industry, persona, company size, offer, and source.
- Record losses clearly: Separate no decision, poor fit, budget constraints, competitive losses, and stalled evaluation.
- Preserve the cohort: Track opportunities by creation period as well as close date.
Decision guardrail: A high win rate can coexist with weak growth if the team creates too few opportunities or only pursues easy, low-value deals.
Selection test: Make win rate a core KPI once enough outbound opportunities have reached a final decision to support a useful comparison. Until then, inspect sales acceptance and stage progression rather than declaring the channel successful or unsuccessful.
Use lost-deal reviews to assign the right corrective action. Poor fit calls for targeting changes; unclear business value calls for better discovery and commercial positioning.
8. Cost per Qualified Appointment
Cost per qualified appointment measures the expense required to create an eligible booked conversation. It helps compare prospecting approaches, but only when every approach uses the same qualification standard.
Formula: Total outbound program cost ÷ qualified appointments booked during the corresponding measurement period.
Include agency fees or internal compensation, prospect data, software, management time, and campaign support. An agency invoice compared with an employee's base salary isn't a fair comparison.
Price the same outcome
Say a founder compares managed outreach with hiring an internal sales development representative. The internal model needs recruiting, onboarding, supervision, systems, and list-building costs alongside compensation.
Use the same cost categories and observation period when assessing a B2B lead generation agency versus an in-house SDR. Otherwise, the cheaper-looking option may have more omitted expenses.
- Keep quality constant: Don't compare loosely screened bookings with sales-ready appointments.
- Show attendance separately: A low booked-appointment cost can conceal expensive no-shows.
- Follow downstream results: Calculate cost per sales-accepted opportunity when the data supports it.
Selection test: Prioritize this metric when deciding how to staff prospecting or whether a program can scale within budget. Don't use it alone to judge a new campaign whose opportunities haven't matured.
The lowest appointment cost isn't necessarily the best outcome. A more expensive conversation can be economically preferable if it produces stronger opportunities, better margins, or a shorter path to purchase.
9. Sales Cycle Length
Slow-moving opportunities create a different problem from low opportunity volume. Sales cycle length measures elapsed time between a defined starting event and a closed deal.
Formula: Total elapsed days for closed-won deals ÷ number of closed-won deals.
Choose the starting event explicitly: first LinkedIn touch, first substantive reply, held discovery meeting, or opportunity creation. Don't switch definitions between campaigns.

Find the stage causing the delay
Gradient Works' 2025 B2B sales benchmark synthesis reports an average B2B sales cycle of 6.5 months in 2025. That broad figure provides context, not an appropriate target for every SMB offer.
Report the median alongside the average when unusually long deals distort the picture. Also track current opportunity age, because a closed-won-only calculation excludes deals that remain stuck.
Say a technology consultancy finds that opportunities linger after proposal delivery. The next action is to inspect stakeholder access, decision criteria, procurement requirements, and the agreed review date, not automatically send more generic follow-ups.
Selection test: Choose cycle length when pipeline exists but revenue timing is unpredictable. Segment by contract size and offer, then measure time within each stage.
A shorter cycle isn't always better. If the team wins smaller deals quickly while abandoning valuable complex purchases, the headline improvement may hide a less attractive commercial mix.
10. Customer Acquisition Cost (CAC) and CAC Payback Period
Customer acquisition cost measures what you spend to win a new customer. CAC payback period measures how long the customer's gross profit takes to recover that acquisition cost.
CAC formula: Attributable sales and marketing acquisition costs ÷ new customers acquired.
Payback formula: CAC ÷ average monthly gross profit per acquired customer.
Include prospecting and closing costs without double-counting shared expenses. Allocate founder selling time, sales compensation, tools, and management effort using a documented method.
Match spending to the customers it produces
Say a services business launches outbound and initially sees high CAC. Dividing current spending by current wins may mislead because those wins came from earlier activity, while the new campaign's prospects are still evaluating.
Use acquisition cohorts and distinguish mature results from provisional estimates. For project-based work, track cumulative realized gross profit against acquisition cost rather than assuming a stable monthly contribution.
- Use gross profit: Revenue alone doesn't account for delivery costs.
- Separate segments: Different offers and customer groups may support different acquisition economics.
- Check cash timing: Invoice terms and payment delays affect cash recovery even when margins look healthy.
Selection test: Make CAC and payback core measures when you have attributable wins, dependable cost records, and usable margin information. Before then, report the components without claiming a settled return.
This supporting video provides additional context for reviewing the outbound process.
How the 10 business development KPIs compare by funnel stage, calculation, and use
| Item | Funnel Stage | Core Calculation | Lead or Lagging | Best For |
|---|---|---|---|---|
| LinkedIn Connection Acceptance Rate | Initial outreach | Accepted requests ÷ requests sent | Leading | Evaluating targeting and profile credibility |
| Reply Rate and Positive Reply Rate | Engagement | Any replies ÷ contacted prospects; positive replies ÷ contacted prospects | Leading | Assessing message and offer resonance |
| Qualified Appointments Booked | Appointment setting | Count of booked meetings meeting agreed qualification criteria | Leading | Measuring qualified pipeline creation |
| Meeting Show-Up Rate | Meeting attendance | Completed meetings ÷ booked meetings | Leading | Assessing booking and reminder effectiveness |
| Lead-to-Opportunity Conversion Rate | Qualification and pipeline | Sales opportunities ÷ qualified leads or conversations | Leading | Evaluating progression into real opportunities |
| Pipeline Value Generated | Opportunity creation | Sum of estimated values of new opportunities | Leading | Connecting outbound activity to potential revenue |
| Win Rate on Outbound-Sourced Opportunities | Closing | Won outbound opportunities ÷ all closed outbound opportunities | Lagging | Assessing prospect fit and sales effectiveness |
| Cost per Qualified Appointment | Appointment setting | Total outbound program cost ÷ qualified appointments | Leading | Comparing prospecting efficiency and channel costs |
| Sales Cycle Length | Closing | Average time from first contact or opportunity creation to deal close | Lagging | Forecasting revenue timing and identifying delays |
| Customer Acquisition Cost (CAC) and CAC Payback Period | Customer acquisition and return | CAC: acquisition costs ÷ new customers; payback: CAC ÷ gross profit per period | Lagging | Evaluating outbound sustainability and investment recovery |
Build a Pipeline Review Routine Around Your Few Core KPIs
Choose three to five core metrics that match your current operating problem. A team testing its first LinkedIn audience needs different priorities from a team with accepted opportunities that won't close.
For a new campaign, start with acceptance, positive replies, and qualified appointments. For a meeting-heavy campaign with weak pipeline, emphasize attendance and opportunity conversion. Once deals mature, bring win rate, acquisition cost, and payback into the core review.
Define the numbers before debating performance
Write down the numerator, denominator, date basis, exclusions, owner, and source system for every KPI. Keep these definitions accessible to the founder, salesperson, and whoever manages outreach.
Salesforce's 2026 State of Sales report says only about one-third of sales teams use an all-in-one platform, while the remainder use an average of eight standalone tools. Don't add reporting complexity without first establishing a CRM system of record and clear update ownership.
At each weekly review, work through the funnel in order:
- Check completeness: Reconcile outreach conversations, bookings, attendance, opportunities, and closed outcomes.
- Locate the earliest weakness: Compare stage conversion with a relevant historical baseline.
- Read the underlying records: Inspect replies, meeting notes, rejection reasons, and overdue next steps.
- Assign a specific change: Name the owner, the variable being tested, and the evidence needed to judge it.
Change the process, not just the target
If acceptance is weak, inspect targeting and profile credibility. If replies are positive but appointments stall, inspect response handling and the meeting request. If meetings happen without opportunity creation, review fit and discovery before blaming prospect volume.
Keep outreach-controlled measures separate from outcomes affected by pricing, delivery capacity, procurement, and closing execution. That makes accountability more useful and prevents the team from optimizing easy counts at the expense of revenue.
Outbound Consulting can help establish tracking that connects prospecting to pipeline progress. Our stated goal is to help clients start winning 1–3 extra deals per month, and a strategy call checks positioning, audience, and growth goals to assess fit rather than assuming the same outcome for every business.
Outbound Consulting builds and manages B2B outbound prospecting systems, including targeting, LinkedIn outreach, qualification, and conversion tracking. Visit Outbound Consulting to discuss your current pipeline bottleneck and arrange a strategy call focused on the KPIs your team needs next.